I’ve had a few posts on X where I’ve shown a few pictures of the Raspberry Pi devices I have been building in the lab over the years. Since these devices are being set up to serve as monitoring endpoints, gathering the cellular statistics provides important contextual data.
TL;DR: It’s pretty easy to grab cellular modem statistics and use them in Zabbix.
Statistic Acquisition
The statistics that are of interest to me for this project are easily acquired from the shell using the qmicli commands with requests aimed at a few of the different areas related to the signal. These are generally executed under sudo conditions, since we’re talking to hardware directly.
NOTE: There are many more commands as part of the API that can query the modem, but I only need to use three for my interest.
Signal Quality Information
The first set of metrics that I want to get is my signal quality. While this isn’t really variable for a stationary device, it does give me a baseline as to what the environment looks like at a given location:
iunderwood@pi5:~$ sudo qmicli -p -d /dev/cdc-wdm0 --nas-get-signal-strength
[/dev/cdc-wdm0] Successfully got signal strength
Current:
        Network 'lte': '-74 dBm'
RSSI:
        Network 'lte': '-74 dBm'
ECIO:
        Network 'lte': '-2.5 dBm'
IO: '-106 dBm'
SINR (8): '9.0 dB'
RSRQ:
        Network 'lte': '-17 dB'
SNR:
        Network 'lte': '-0.8 dB'
RSRP:
        Network 'lte': '-113 dBm'
underwood@pi5:~$
Serving System
The next set of stats is to get the information of the system that I am connected to. This provides some rich information about the service provider side of the network. This is particularly interesting to me since this particular Pi is going to be connected in an area with an in-building DAS. In theory, a DAS failure will result in the Pi reconnecting to the closest cellular infrastructure that it can find, if at all. Therefore a fluctuation in that data could provide a heads up when it comes ot engaging the carrier.
underwood@pi5:~$ sudo qmicli -p -d /dev/cdc-wdm0 --nas-get-serving-system
[/dev/cdc-wdm0] Successfully got serving system:
        Registration state: 'registered'
        CS: 'attached'
        PS: 'attached'
        Selected network: '3gpp'
        Radio interfaces: '1'
                [0]: 'lte'
        Roaming status: 'off'
        Data service capabilities: '1'
                [0]: 'lte'
        Current PLMN:
                MCC: '310'
                MNC: '260'
                Description: 'T-Mobile'
        Roaming indicators: '1'
                [0]: 'off' (lte)
        3GPP time zone offset: '-240' minutes
        3GPP daylight saving time adjustment: '1' hours
        3GPP cell ID: '12521986'
        Detailed status:
                Status: 'available'
                Capability: 'cs-ps'
                HDR Status: 'none'
                HDR Hybrid: 'no'
                Forbidden: 'no'
        LTE tracking area code: '22001'
        Full operator code info:
                MCC: '310'
                MNC: '260'
                MNC with PCS digit: 'yes'
underwood@pi5:~$
RF Channel
The last data I want getting the RF information associated with the current connection.
underwood@pi5:~$ sudo qmicli -p -d /dev/cdc-wdm0 --nas-get-rf-band-info
[/dev/cdc-wdm0] Successfully got RF band info
Band Information:
        Radio Interface:   'lte'
        Active Band Class: 'eutran-66'
        Active Channel:    '1250'
Band Information (Extended):
        Radio Interface:   'lte'
        Active Band Class: 'eutran-66'
        Active Channel:    '66786'
Bandwidth:
        Radio Interface:   'lte'
        Bandwidth:         '20'
underwood@pi5:~$
One thing I found neat in my investigation, was to find out that the “active channel” is a mathematical value that is used to derive the upstream and downstream carrier frequencies, which is mighty cool!
WWAN IP Address
The IP that I have on the WAN is also really useful information to have. It is not uncommon for an IoT device to get a different IP each time it connects to the cellular network, or to have that address changed periodically.
I have a shell script that runs in a cron job that checks the cellular interface, reconnects if necessary, and notes changes to the WWAN IP and places that last address in /var/log/wwan.log. While that script is a little bit out of scope, the formatting is here:
2025-10-08T17:27:03-0400 - %WWAN-5-ADDR_CHANGE: 5G IP is now 10.22.129.158/30
2025-10-12T13:16:03-0400 - %WWAN-5-ADDR_CHANGE: 5G IP is now 10.22.155.193/30
2025-10-17T01:24:03-0400 - %WWAN-5-ADDR_CHANGE: 5G IP is now 10.22.139.25/30
I come from about 30 years of Cisco experience, so don’t beat me up too much for the format.
In any event, the log reports any changes to the cellular IP. This is handy as the cellular network doesn’t lend itself well to using dynamic DNS in the same way I am used to with my WiFi devices. In my experience, the address changes every time the modem reconnects to the network.
Zabbix Ingestion
With the statistics in mind that I wanted to report on, the next step was getting them into something useful. The plain text output from the QMI CLI tools are parsable and digestable, but they are not in any way structured. There appear to be a few projects out there that seem to use the API to generate something a little more machine-friendly, but the effort felt out of place for what I’m trying to do here.
This section does assume that you’ve already installed Zabbix Agent 2 successfully and are able to at least pull in some system statistics with one of the included templates.
Zabbix Agent 2
Fortunately, ir’s easy to ingest command output via Zabbix Agent 2, which is available on a huge swath of platforms. The intent here is to grab the three values as “raw” information and use a series of dependent items to extract the explicit slices of data that are of interest.
/etc/sudoers
Accessing the modem data requires root privileges. The Zabbix user does not have this by default.
To resolve this, we give the zabbix user very narrow sudo permissions, allowing the agent only to use elevated status to run the qmicli command. Since this is scripted, the command needs to be allowed without a password.
The following line gets added to the sudoers file:
zabbix ALL=NOPASSWD: /usr/bin/qmicli */etc/zabbix/zabbix_agent2.conf
Getting the raw data leverages the userParameter options that are part of the agent. Each user parameter is represented by a key, followed by the shell command that generates some kind of output.
These are the parameters in play which I added to the UserParameter section:
UserParameter=wwan.addr,tail -1 /var/log/wwan.log
UserParameter=nas-get-signal-strength.raw[*],sudo qmicli -p -d $1 --nas-get-signal-strength
UserParameter=nas-get-serving-system.raw[*],sudo qmicli -p -d $1 --nas-get-serving-system
UserParameter=nas-get-rf-band-info.raw[*],sudo qmicli -p -d $1 --nas-get-rf-band-info
With the user parameters installed, the agent can be restarted and the specific data points can be requested from the Zabbix Server or applicable proxy.
Zabbix Template
Adding the data into Zabbix can be done with a series of raw items that grab the straight text values, and then extract the data from the raw text into discrete values.
There’s a lot to that, but in the meantime, the template which will work with the definitions described in the above sections can be found on my GitHub account here:
https://github.com/iunderwood/wwan-toolkit/blob/master/zbx_cellular_wireless_wan.yaml
The macro {$WDS_DEVICE} is available to be definied if the wireless modem is not the default at /dev/cdc-wdm0. Unless you have mutlltiple modems, this can be left at the default.
The tempate comes with a neat Cellular Information dashboard which ties all the values in the template together. This is probably one of my favorite features of Zabbix.
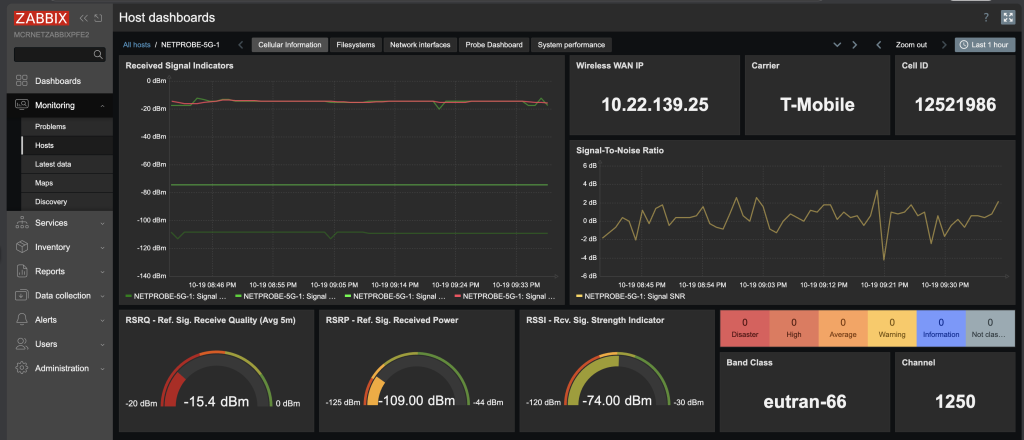
The signal where I have this Pi isn’t really all that good, as the graph indicates. However, it’s still passable for what I need it to be and do.
In a future post, I’ll go over a couple of tests that I run periodically to gauge the health of the network and how those are integrated with Zabbix as well.
References
- freedesktop.org – QMI CLI Man Page
This post originally appeared on Underwood HQ.